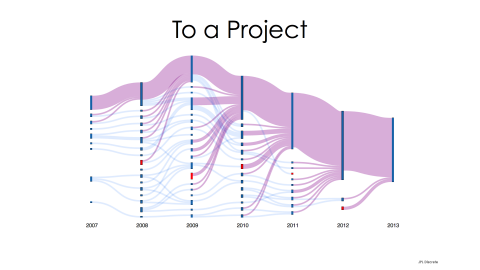
This image highlights how discrete individuals at JPL have moved from project to project over time. It’s a great example of using “dark big data” from HR records. Visualizations like this could be used one day to predict future JPL leaders based on their paths from one project to another.
A conversation with Tom Soderstrom, IT Chief Technology Officer, Jet Propulsion Laboratory about big data and analytics
THE ENTERPRISERS PROJECT (TEP): You see so much in the press about Big Data being an overhyped trend, with government agencies and private companies gathering so much data they’re drowning in it. How do you avoid doing that at JPL?
SODERSTROM: My job as IT CTO is to envision the future and taste-test it now to confirm its relevancy. We are taking exactly the same approach to big data to see what is going to matter. JPL has a proud history of handling science and engineering data in a big way. The question is, could we augment this approach with a rapid prototyping, grassroots approach and mine IT big data as well? One insight is that analytics, specifically visual analytics, is a great enabler to have a big data conversation with the end user. Another insight was that running analytics as a ‘startup’ was absolutely the right thing to do, because we could get the results quickly.
One thing that surprised me, though, was that in many cases we found these incredible insights quickly and we wanted to climb higher, but we hadn’t saved that type of data because we hadn’t realized that we would need it later. So what that has led to is new architectures where we will store more data.
THE ENTERPRISERS PROJECT: One of the big data projects you focused on was in HR. What did you find there?
SODERSTROM: This was very interesting, because we looked at data from hiring students over the last five years at JPL. First our IT Data Scientist, Rob Witoff, quickly created a word cloud from the requisitions for summer students that we had sent out over the past five years. I looked at it and said: “Okay, that’s interesting, but it’s not exactly what I need. I need these five years all lumped into trends.” So that quickly became five word clouds, one per year. Then we said, “Okay, I kind of can see it, but isn’t there a better way of visualizing the trends?” Rob then created a trend visualization chart, and you can see demand for each technology skill as it ramps up or down. That was useful immediately because you can very quickly see the trends.
As we showed that data to others, our Mars Exploration Rover project manager said, “That’s interesting. Can I use that model to look at the trouble reports for the Rover over the years?” And, yes we could. The key to that is that when people see a visualization of someone else’s type of data, they can apply that to their own. In this case HR data and spacecraft both benefitted from a trends visualization. When a data owner says, “I wonder if you could do this with my data?” you have a win that will keep winning, as long as you react quickly to answer the question. This leads to a concept we call question farming, and our IT Data Scientist is an awesome farmer.
TEP: What is question farming?
SODERSTROM: Question farming happens when you’ve gathered a small portfolio of several different visualizations of different types of big data. You sit down with a data owner and say, “Here’s what other people have been able to see from their data; what do you think?” Invariably, a question will pop up from them saying, “Okay, can you apply that visualization to this other data? How could this compare?” Each question leads to another, more valuable question.
So in the case of HR, we ‘farmed’ another question about what happened to people not as we hired them, but when one of their projects finished. Where did those people go? Rob was able to analyze that and find out where they went, and show it visually. Then someone else said, “That’s interesting. But what I want to know if there’s a way to predict who is going to be successful at JPL?” And that’s a question we are currently farming. So, as in any successful project, one question led to a more interesting one, and then another one.
Tom is IT Chief Technology Officer at the Jet Propulsion Laboratory (JPL) in Los Angeles, CA and a member of the Enterprisers Editorial Board. JPL is the lead U.S. center for robotic exploration of the solar system and conducts major programs in space-based Earth sciences. JPL currently has several dozen aircraft and instruments conducting active missions in and outside of our solar system.


